



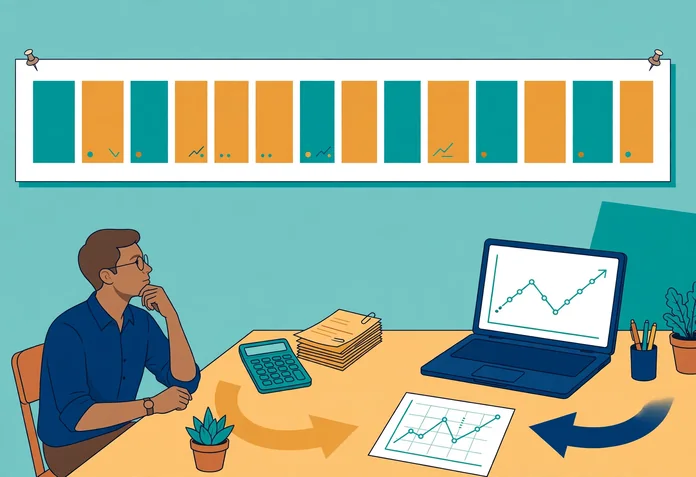
Most small business owners find out they have a cash problem from the bank balance, usually on the morning a big payment is due. By then the options are few and expensive. A rolling 13-week cash-flow forecast moves that moment forward. Instead of reacting to the balance, you work from a week-by-week picture of the money you expect to receive and the money you have committed to pay, and you update it every week so the picture never goes stale. The forecast will not always bring good news, but it brings the news early, while you can still act on it.
In short: how the rolling forecast works
A rolling 13-week cash-flow forecast is a grid with one column for each of the next 13 weeks, rows for money in and money out, and a running balance that carries from week to week. You build it once, from real invoices, pay dates and payment schedules, and then keep it current with a short weekly routine:
- Replace the finished week’s estimates with what actually arrived and what actually left the account.
- Move any receipt that slipped into the week you now expect it, not the week you hoped for.
- Add new invoices, orders and commitments, and remove anything that has been cancelled.
- Drop the finished week, add a fresh week 13 at the end, and check the lowest balance anywhere in the grid.
Why 13 weeks, and why rolling
Thirteen weeks is one quarter, and the quarter is the natural planning horizon for a small business. It is long enough for the big, lumpy obligations to show up: three rounds of monthly bills, every payroll cycle, rent, loan payments and the quarterly tax dates that catch so many owners out. It is also short enough to stay honest. Most of what enters the grid in the next 13 weeks already exists somewhere in your records as an issued invoice, a confirmed order, a signed lease or a statutory due date. Stretch the window to a year and the later months fill up with sales you are guessing at, which makes the whole document feel precise while resting on very little.
A shorter window has the opposite problem. A four-week view feels manageable, but it hides the tax payment sitting in week nine and the slow month that follows your best one. By the time those enter a four-week forecast, you have almost no room left to respond. The 13-week window is where the problems first become visible while they are still cheap to fix.
The rolling part matters as much as the length. A fixed forecast for the quarter shrinks as the quarter passes: by week ten it shows you three weeks and tells you nothing about the month after next. A rolling forecast never shrinks. Each week you retire the week that just finished, correct it with what actually happened, and add a new week at the far end. The horizon stays a full quarter ahead permanently, and the near weeks rest on actual bank figures rather than on estimates you made two months ago.
This is also why a cash-flow forecast is not a budget. A budget sets what you intend to spend and earn over a period, usually a year, and it is the right tool for direction and discipline. The forecast answers a narrower and more urgent question: in which specific weeks will money be tight, and by how much? The U.S. Small Business Administration (SBA), in its guidance on why businesses should bother with financial forecasts, points forecasters at the drivers underneath the numbers: invoices out with customers and waiting to be paid, inventory that is not moving, bills falling due. Watch those drivers weekly and the forecast stays connected to the real business.
The five inputs you need before you start
You do not need special software or a finance background to build the first version. You need five inputs, all of which already exist in a business that keeps basic records. Gather them before you draw the grid, because a forecast built from memory will quietly leave out exactly the payments that matter.
1. Your opening cash balance
Start with the money actually in your business bank accounts today, cleared and available. If you run more than one account, add them together and treat the total as one pot for forecasting purposes, even if you keep the accounts separate in practice. Use the bank figure, not the figure in your accounting records, if the two differ; uncleared items explain most of the difference, and cash you cannot spend yet does not belong in the opening balance. The SBA Ascent guide to understanding cash flow statements builds its cash flow walkthrough the same way: enter the starting balance first, then the amount and timing of money coming in, then the amount and timing of money going out. A forecast is that same discipline pointed at the future instead of the past.
2. Expected receipts, customer by customer
List the money you expect to receive, and list it by customer, not as one hopeful total. Start with invoices you have already issued: take them from your aged receivables list, with the week each payment is realistically due. Add confirmed orders that will be invoiced and paid inside the window. For regular repeat income, such as retainers or standing contracts, enter it at the level it has actually reached in recent months, not the level you are aiming for. One line per significant customer keeps the forecast honest, because it forces you to think about that customer’s payment behaviour rather than about sales in the abstract.
3. Payroll, on the dates it leaves
Payroll is the largest fixed outflow in most small businesses and the least flexible, so it goes into the grid early and exactly. Enter each pay run in the week the money leaves the account, at its full cost: gross pay, the employer’s own payroll taxes or contributions, and any amounts you withhold and remit separately, in the weeks those remittances fall due. Owners who forecast with net pay only are understating their biggest cost and building a surprise into every pay week.
4. Supplier, tax and other operating payments
Take supplier payments from the invoices you hold and the terms you have agreed, placed in the weeks you will actually pay them. Add the recurring operating payments that arrive whether sales are good or bad: utilities, phone and software subscriptions, fuel, cleaning, and the rest of the direct debit cluster. Then add your tax payments on their real dates: sales tax or VAT returns, payroll remittances and any quarterly instalments your tax system requires. Tax dates are the classic forecast omission, because they sit outside the weekly rhythm of trading. They belong in the grid from day one, in the correct weeks, at the best estimate you can make from your records.
5. Loan, lease and rent payments
Finish with the payments fixed by contract: loan repayments, equipment finance, vehicle and premises leases, and rent. Enter the full payment that leaves the account, not just the interest portion, because the forecast tracks cash, not accounting cost. These lines are the skeleton of the grid. They rarely change, they cannot be moved without a conversation, and knowing exactly where they sit tells you how much room the rest of the business has to move in.
Building week 1 from real invoices, not hopes
Build the grid in a deliberate order. Put the money out first, because outflows are mostly committed and knowable: payroll dates, rent, loan payments, supplier invoices you already hold, tax dates. Then add the money in, which is where optimism creeps in. For the first four weeks, count receipts only from invoices already issued and orders already confirmed. For weeks five to thirteen, you can include expected repeat business from regular customers, entered cautiously at recent actual levels. What you must not do is place a hoped-for sale, a quotation or a promising conversation into a named week as if it were income. The moment one imaginary receipt enters the grid, every balance after it is imaginary too.
The receipts list is your aged receivables report, worked through customer by customer: the same working discipline described in what a bookkeeper does for a small business, where chasing and recording payments is core work, not admin. For each invoice, enter the week the money will actually clear your account. That is the invoice date plus the customer’s terms plus the delay that customer usually adds, which the next section covers. Payments go in on the week you will send them, which for suppliers is your planned payment run, not necessarily the day the invoice arrived.
Keep a short note against any line that rests on an assumption: expected order, seasonal estimate, customer who pays when chased. The note takes seconds to write and saves you, three weeks later, from treating an assumption as a fact. Your first build will be rough. That is expected, and it is not a reason to delay starting: the weekly update corrects the grid far faster than waiting for perfect data ever will.
How to treat late payers and seasonal swings
Terms on paper and payment in practice are two different numbers, and the forecast must use the second one. Look at what each significant customer actually did over the last quarter: if a customer on 30-day terms pays on day 45 on average, their invoices belong in the grid at day 45. This is not pessimism; it is the difference between a forecast and a wish. For a customer whose payment timing swings widely, use the slower end of their recent range in the main forecast and note the faster outcome as the upside, never the other way round.
Concentration deserves a specific test. If one customer accounts for a large share of a month’s receipts, run the slip test: move their biggest expected payment two weeks later in a copy of the grid and look at what happens to the lowest balance. If the answer frightens you, the forecast has done its job, because you now know which single phone call, reminder sequence or early conversation protects the quarter.
Seasonality goes in the same way, from evidence rather than memory. Work from last year’s bank statements for the same weeks: mark the peaks and troughs, your own shutdown periods and your customers’ shutdown periods, the annual renewals and licence fees that land once a year, and any pattern in when your sector’s customers place and pay for work. Enter the seasonal shape at last year’s level unless you have a concrete reason to change it, and write that reason in the notes. A growing business can scale the pattern up deliberately; what it cannot afford is to assume the shape has flattened just because a flat year would be easier to manage.
The weekly update: keeping the forecast rolling
Fix a weekly slot, about half an hour, ideally on the day you do your banking or invoicing, and protect it the way you protect payroll. The routine has four moves. First, replace the finished week’s forecast figures with the actual money in and out, and glance at the difference: the gap between forecast and actual is the most useful training data the business produces, because it shows you exactly which assumptions are drifting. The FDIC’s Money Smart for Small Business curriculum, in its Managing Cash Flows module, is built on that same separation between cash flow actuals and cash flow projections, and on using the actuals to make the next projection better.
Second, re-date anything that slipped. A receipt that did not arrive moves to the week you now genuinely expect it, with a note about why. Third, add the week’s new invoices, orders and commitments, and delete anything cancelled. Fourth, drop the finished week, add a new week 13, and read the whole grid again, lowest point first. Save each week’s version before you overwrite it. After a couple of months you will be able to see your own forecasting accuracy improving, and you will know which customers’ forecast dates you can trust and which always need a buffer.
Expect the near weeks to become precise and the far weeks to stay directional. Weeks one to four should be tight enough to make payment decisions from. Weeks nine to thirteen exist to show the shape of what is coming: the tax date, the seasonal dip, the cluster of renewals. Judging the far end of the grid by near-end standards is how owners talk themselves out of a tool that was working.
Reading the result: surplus, pinch point or shortfall
A finished forecast resolves into one of three pictures, and each picture calls for a different response. Reading it well means naming which picture you are looking at, for the quarter as a whole and for its worst fortnight in particular.
A comfortable surplus
If the balance stays healthy across all 13 weeks, the forecast has bought you choices. The three sensible responses are to hold a deliberate buffer against the next known big payment rather than letting the balance drift into spending; to schedule discretionary purchases, equipment, vehicle work, a marketing push, into the strongest weeks instead of the week the idea occurs to you; and, only if the surplus repeats quarter after quarter, to treat it as genuinely spare and decide what it is for, rather than letting fixed costs grow quietly to absorb it.
A pinch point
A pinch point is a dip: the balance falls below the level you are comfortable with, then recovers on receipts that are already scheduled. Pinches are timing problems, and timing problems have timing solutions. Invoice now for work already delivered, so the receipt lands before the dip rather than after it. Chase the specific invoices due in the weeks before the pinch, personally and early, instead of sending a general reminder to everyone. And move flexible spending to the far side of the dip, inside the terms you have agreed, so the same money leaves two weeks later when the balance can carry it.
A real shortfall
A shortfall is different in kind: the balance goes below zero, or below the minimum your account or your nerve requires, with no scheduled receipt that repairs it. The responses are conversations, and the forecast’s whole value is that you can have them early. Talk to your bank or lender while the gap is still weeks away and take the forecast with you; a lender shown a dated, specific gap and a plan is being asked a much easier question than a lender called on the day a payment bounces. Agree revised timing with key suppliers before their due dates arrive, not after. Then cut and defer inside the business: pause drawings and discretionary spend, and work through how to reduce overhead costs in a business for savings that do not damage your ability to trade. None of this is pleasant, but all of it is cheaper in week one than in week nine.
A worked example: one quarter in round numbers
The table below is illustrative only. It follows a small services business with an opening balance of $12,000, regular customer receipts, payroll in weeks 2, 6 and 12, rent and a large supplier payment in weeks 4 and 8, a quarterly tax payment landing with payroll costs in week 9, and its largest customer paying a major invoice in week 11. The figures are round, invented for this example, and are not a benchmark for any real business.
| Week | Money in ($) | Money out ($) | Closing balance ($) |
|---|---|---|---|
| 1 | 6,000 | 4,500 | 13,500 |
| 2 | 3,000 | 5,000 | 11,500 |
| 3 | 7,500 | 4,000 | 15,000 |
| 4 | 4,000 | 6,500 | 12,500 |
| 5 | 5,500 | 4,500 | 13,500 |
| 6 | 2,500 | 5,000 | 11,000 |
| 7 | 8,000 | 4,000 | 15,000 |
| 8 | 4,500 | 6,000 | 12,500 |
| 9 | 3,000 | 9,500 | 6,000 |
| 10 | 3,500 | 4,500 | 5,000 |
| 11 | 11,000 | 4,000 | 12,000 |
| 12 | 5,000 | 5,500 | 11,500 |
| 13 | 6,500 | 4,500 | 13,500 |
Read the balance column, not the totals. The quarter ends comfortably at $13,500, and total money in comfortably exceeds total money out, yet weeks 9 and 10 dip to $6,000 and $5,000 because the tax payment lands in a heavy month. An owner watching only the monthly totals would call this a good quarter. An owner with this grid knows, from week 1, exactly which fortnight needs care, and can bring a discretionary purchase forward into week 7 or push it past week 11 with full knowledge of the effect.
Now run the slip test on it. If the week 11 receipt from the largest customer moves to week 13, the closing balances for weeks 11 and 12 fall to $1,000 and $500 before the money arrives. Nothing about the business has changed: same sales, same costs, same quarter. Only the timing moved, and a comfortable quarter became a fortnight of real danger. That is the single most useful insight a rolling forecast produces, and you cannot get it from a bank balance or a profit figure.
Spreadsheet or software: the tool matters less than the routine
A spreadsheet is enough to start, and for most small businesses it stays enough: thirteen columns, rows for money in, money out and the running balance, and a line for each major customer and payment type. Accounting software can make the weekly update faster by feeding in actual receipts, payments and aged invoice lists, and if you already use it, connect the forecast to those reports rather than retyping figures. What does not work is three versions of the truth: a spreadsheet the owner keeps, a report the bookkeeper keeps and a number in someone’s head. Pick one grid, one owner for it, and one weekly slot. The forecast earns its keep through the routine, not through the sophistication of the tool it lives in.
Common errors that make a forecast useless
Most failed forecasts fail in one of six predictable ways.
- Counting invoiced sales as cash. An invoice is a promise with a date problem. Receipts enter the grid when money is expected to clear, never when the invoice is issued.
- Forecasting payroll at net pay. Leaving out employer payroll costs and remittance dates understates the biggest line in the grid and guarantees a monthly surprise.
- Building it once. A static forecast describes the business as it looked on the day it was made. Within a month it is history, and owners who were burned by a stale forecast often blame forecasting itself.
- Filling gaps with hopes. Unnamed sales lines in specific weeks, at round values, are wishes wearing a spreadsheet’s clothing. If you cannot name the customer, it does not get a week.
- Forgetting the small print. Clustered direct debits, annual renewals, one-off fees and deposits are individually small and collectively the difference between a tight week and a missed payment.
- Working in monthly totals. A month can be comfortably positive while its second week is impossible. Weekly columns are the entire point of the method.
Underneath most of these sits a records problem rather than a forecasting problem. The forecast can only be as current as the invoicing, payment runs and reconciliations behind it, which is why it belongs inside the regular rhythm of the accounting cycle steps a business works through every period, not as a separate heroic effort once a quarter.
What a forecast can and cannot do
Be clear about the limits, because overselling the tool is how it gets abandoned. A forecast cannot create cash, make a customer pay, or prevent a shortfall by itself. It converts surprises into scheduled problems: it tells you the size of a gap, the week it lands in and how long you have to respond. The responses still have to come from the business, in pricing, costs, terms and conversations held early enough to matter.
It also cannot fix a structural gap. If the grid shows outflows beating inflows in most weeks, in most versions, the business does not have a timing problem; it has a model that spends more than it brings in, and the answer lies in prices, costs or the offer, not in a better spreadsheet. This article is general information about a planning method, not regulated financial or accounting advice for your specific business. If your forecast shows a persistent shortfall, raise it with your accountant or your lender while it is still a forecast, not after it becomes a balance.
Sources used for this article
- U.S. Small Business Administration, Why Bother with Financial Forecasts: https://www.sba.gov/blog/2017/2017-09/why-bother-financial-forecasts/
- U.S. Small Business Administration, Ascent learning platform, How to Understand Cash Flow Statements: https://ascent.sba.gov/8d/4b/6855ceed413ca6384044018eb2f6/your-business-financial-strategy-2-3-financial-statements-business-growth-decisions-tool.pdf
- Federal Deposit Insurance Corporation, Money Smart for Small Business, Module 10: Managing Cash Flows (participant guide): https://www.fdic.gov/consumer-resource-center/mssb-m10-pg.pdf
Frequently asked questions
What is a rolling 13-week cash-flow forecast?
A week-by-week projection of the money you expect to receive and pay over the next 13 weeks, with a running balance for each week. It is called rolling because every week you replace the oldest week with actual figures, drop it from the front and add a new week at the end, so the forecast always looks a full quarter ahead.
Why does the forecast cover 13 weeks?
Thirteen weeks is one quarter. That is long enough to include payroll cycles, rent, loan payments and quarterly tax dates, and short enough that most figures rest on real invoices, orders and schedules rather than guesses. A shorter window misses the big payments, and a longer one fills up with estimates you cannot yet support.
What should I include in a 13-week cash-flow forecast?
Five things: your opening cash balance; expected receipts listed customer by customer; payroll on its actual pay dates; supplier, tax and other operating payments on their due dates; and loan, lease and rent payments. If a payment is committed or a receipt is genuinely expected, it belongs in the grid in the week you expect the money to move.
How often should I update a cash-flow forecast?
Once a week, in a fixed slot. Replace the finished week’s estimates with what actually arrived and left, move any receipt that slipped, add new invoices and commitments, then drop the finished week and add a new week 13. A forecast that is updated monthly is a history document, not a warning system.
What should I do if my forecast shows a shortfall?
Act while it is still weeks away. Chase the receipts that can land earlier, agree revised timing with suppliers before payments are due, defer spending that is flexible, and talk to your bank or lender early, with the forecast as evidence. The same gap found in the week it happens leaves you with far fewer and more expensive options.
Can I build a 13-week forecast in a spreadsheet?
Yes. A spreadsheet is enough: one column per week, rows for money in, money out and the running balance, and one line per major customer and payment type. Software can help you pull in actual figures, but the value of the forecast comes from the weekly update routine, not from the tool you build it in.
